How do you measure performance? How do you visualize performance?
Just because a common theme of Management 3.0 is experimentation and learning, doesn’t mean we’re not methodological — it may mean we’re even more so than most organizations! We strongly believe in setting objectives and measuring things often in order to make decisions toward a purpose. We hope the Scoreboard Index is a Management 3.0 practice that will help your performance management process in a positive way.
The Scoreboard Index is a spin-off from what’s commonly called OKRs or Objectives and Key Results, and is satisfy to meet the following three needs:
- allows for a weekly evaluation of how well your team and you are doing, in different contexts, allowing you to reprioritize efforts iteratively, using real data.
- is simple and doesn’t take a lot of time, and which allows for the flexibility to change metrics whenever we want.
- is visual so you and your team can, at a glance, easily understand areas in need of improvement and those that are succeeding already.
How does Scoreboard Index work?
Each Scoreboard Index begins by defining a few qualitative objectives like “engage more with customers.”
For each qualitative objective, define two to four quantitative objectives like “more activity on customer-facing Slack channel” or “more comments on blogposts.” You want to rely on more than one metric in order to find creative ways to quantitatively assess each qualitative objective. No metric is perfect and by focusing on only one KPI or key performance indicator per objective, you risk people gaming the system toward financial goals. By having a balance of qualitative and quantitative objectives, you help the team stay focused on team and company values and simply better work.
And for each quantitative objective, you set two lower bounds — a number that you’d feel devastated and another that would make you unhappy and two upper bounds — a number that would make you feel happy and another that would make you feel just plain ecstatic.
When we say you that doesn’t just mean you as the manager. Since we believe self-organization is key to a well-managed system, you should allow your team to collaborate in setting both kinds of objectives.
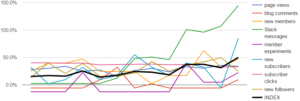
Then, once you set your objectives, you then check all your numbers on a weekly basis. Most often this is done in a spreadsheet, and, since spreadsheets are rough on the eyes, you can then turn it into a graph that helps make it more visual and colorful. Of course setting it all up does take some time but once it’s good to go, updating the scoreboard should take about half an hour a week — less if you find ways to automate this data.
Of course, since you should be transparent about objectives, this is definitely a task that can be delegated to someone that’s more numerically inclined, if you aren’t. What’s important is that the whole team gets to take part in setting the goals and gets insight into how the goals are going (or aren’t) and that you continue to revisit these objectives.
The Scoreboard Index satisfies at least seven of the 12 principles for good metrics.
Scoreboard Index Tips
Every person, team, and unit can create its own scoreboard index. All are responsible for their own measures.
Make sure that objectives and measurements are transparent and available to everyone else in the organization.
You should make the results visually interesting and abundantly available, or else the measures won’t make any difference.
