by Sari Linder
Management 3.0 is an evolving set of tools, games, and practices that reinforce the idea that management is a group rather than an individual responsibility in an organization.
Management 3.0 seeks to achieve the most efficient way for an organization to meet its strategy and objectives while maintaining the workforce’s happiness as a priority. The company is rooted in the complexity theory, complexity thinking, and Snowden’s Cynefin framework. Management 3.0’s (and Cynefin) main thesis is that it is not possible to control a complex system but it is possible to guide it through experiments and observing constraints.
Management 3.0 rejects the approach of traditional management to reducing organizational complexity by introducing rules, processes, and best practices. Instead, Management 3.0 views an organization as a living, complex adaptive system with constituting parts that show complex behaviors in adapting to a changing business environment. It handles organizational complexity with complexity by assuming subjectivity, keeping options open, and using a diversity of perspectives.
While the Cynefin framework is well-established theoretically, Management 3.0 uses a on hands-on approach, running experiments and playing games that increase employee engagement and encourages feedback. We see management 3.0 as a nice extension to existing methodical approaches to managing products, projects, and programs, whether these approaches are conservative or agile.
What is the Scoreboard Index?
Since Management 3.0 is all about experiments and learning, one might be tempted to believe that it’s not methodical. That is actually not the case. The scoreboard index is proof of Management 3.0’s credence to using measurements in order to progress towards achieving organizational objectives.
A scoreboard index is a tool for measuring and visualizing performance and improvement. The steps for using a scoreboard index are here and should be done in consultation with your team:
#1: Define a few subjective goals for your team. For instance, ‘more engaged customers’. For each subjective goal, define 2-4 objective metrics. For instance, the metrics ‘page views per week’ and ‘blog comments per week’.
#2: For each metric, establish two lower bounds: This is a number that makes you feel devastated and another one that makes you feel unhappy. For instance, I would be unhappy if my ‘page views per week’ was 200 and devastated if it was 100.
#3: For each metric, establish two upper bounds: A number that makes you feel happy and another one that makes you feel ecstatic. For instance, I would be happy if my ‘page views per week’ was 500 and ecstatic if it was 1000.
#6: Observe these metrics on a regular basis: Weekly or monthly, depending on the availability of the data, and record the metric values in a sheet.
#7: Convert the metric values into percentages using the four lower and upper bounds you established in steps 3 and 4.
#8: Take an average of the percentage values in order to get your subjective goal index for the period.
#9: Visualize your findings, in a graph for ease of comprehension.
The Scoreboard Index has three great advantages:
#1: It enables the team to regularly evaluate its performance and reprioritize the work if needed.
#2: It is simple, visual, easy to understand, and does not take much time to keep updated.
#3: It is flexible in that it permits changing a metric without fear of breaking the evaluation of the main index.
We experimented with the scoreboard index in a certain context, which we’ll discuss here.
Experiment Venue
The venue of the scoreboard index experiment is Agile Gothenburg. Agile Gothenburg is a nonprofit organization that provides a community for those who are practicing, passionate about or interested in Agile approaches to management and leadership in Gothenburg, Sweden, as well as the Nordics. The group offers insights into the manifestation of Agile behaviors and concepts in leadership, project, program, portfolio, product, delivery, and service management, through sharing knowledge, experiences and lessons learned.
The format varies between workshops, open space meetings, featured talks, and group creativity techniques.
Agile Gothenburg is interested in tracking and improving two aspects:
Its contribution to the Agile communities, and the social media engagement of these communities. The abov aspects can be considered as subjective goals of the organization.
Hereafter, we will refer to the first and second goals as ‘Contribution Goal’ and ‘Engagement Goal’ respectively.
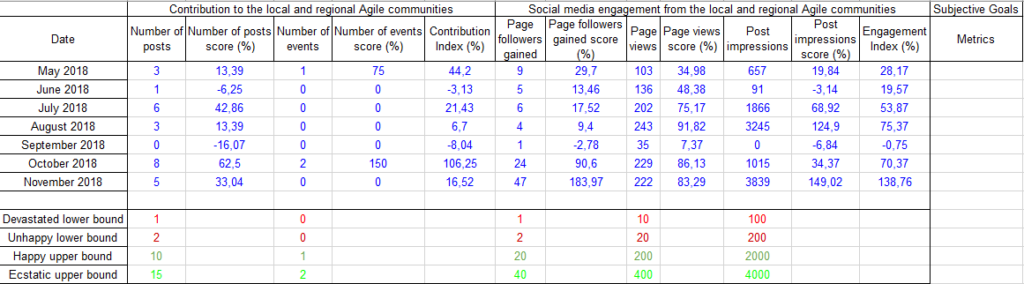
Two metrics are defined for the Contribution Goal. They are listed below together with their lower and upper bounds.
#1: Number of events: devastated 0, unhappy 0, happy 1, ecstatic 2
#2: Number of posts: devastated 1, unhappy 2, happy 10, ecstatic 15
Three metrics are defined for the Engagement Goal. They are listed below together with their lower and upper bounds.
#1:Page followers gained: devastated 1, unhappy 2, happy 20, ecstatic 40
#2: Page views: devastated 10, unhappy 20, happy 200, ecstatic 400
#3: Post impressions: devastated 100, unhappy 200, happy 2000, ecstatic 400
All the metrics above are observed on a monthly, rather than weekly basis for two reasons:
Arranging an event takes at least two weeks and social media analytics is aggregated monthly. The metric values are recorded over a period of six months from May 2018 to November 2018. The lower and upper bounds are used in order to convert the metric values into percentage values. An average of these percentage values is taken in order to obtain two performance indexes, one for the Contribution Goal and another for the Engagement Goal. The results and a discussion appear in the following section.
Results and Analysis
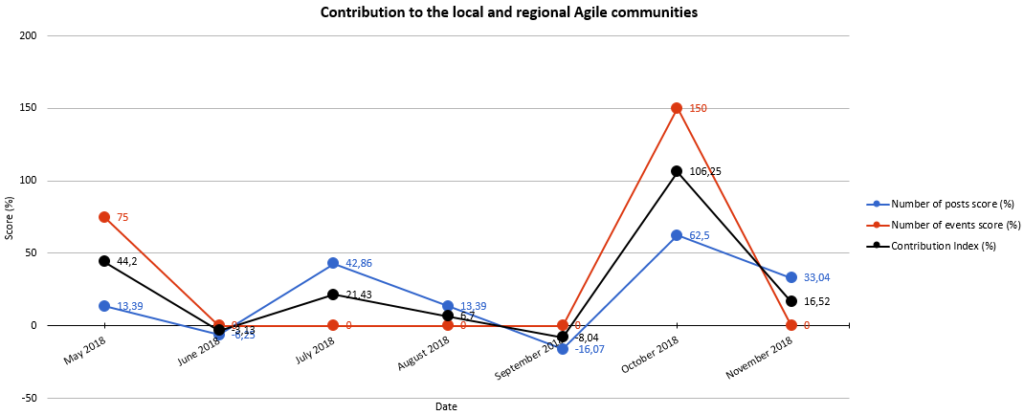
The metric values for the contribution and engagement goals are in the following table:
In general, the engagement and contribution indexes fluctuate in roughly the same way and the main message is:
Engagement increases with an increase in contribution
- In August 2018, the contribution (6.7%) is low but the engagement (75.37%) is high. The reason behind this is the use of three LinkedIn campaigns in that month.
- In October that year, both the contribution (106.25%) and the engagement (70.37%) were high. This is the month where Agile Gothenburg distributed the message and takeaways from the Agile People Sweden Conference.
- In November, the contribution (16.52%) is relatively low. However, the engagement (138.76%) is quite high. The reason is that Agile Gothenburg onboarded a new, well-connected volunteer in November.
To conclude
A scoreboard index is an excellent tool for measuring and visualizing performance and improvement. The Agile Gothenburg would benefit from regular marketing campaigns, involving bigger events, and collaborating with well-connected individuals in the community.
Photo Credit Jurgen Appelo (founder and creator of Management 3.0), Noop.Nl

Rather on focusing on weekly (or monthly data) I would recommend to focus on the 12 week (or 12 month) rolling average of the data, to observe tendency, grothw or improovment.
The 4 limit idea is great to define urgency acctinons in case of being low and learning and giving positive feedback if they are high..
Thanks.